Home
Last updated December 5, 2025
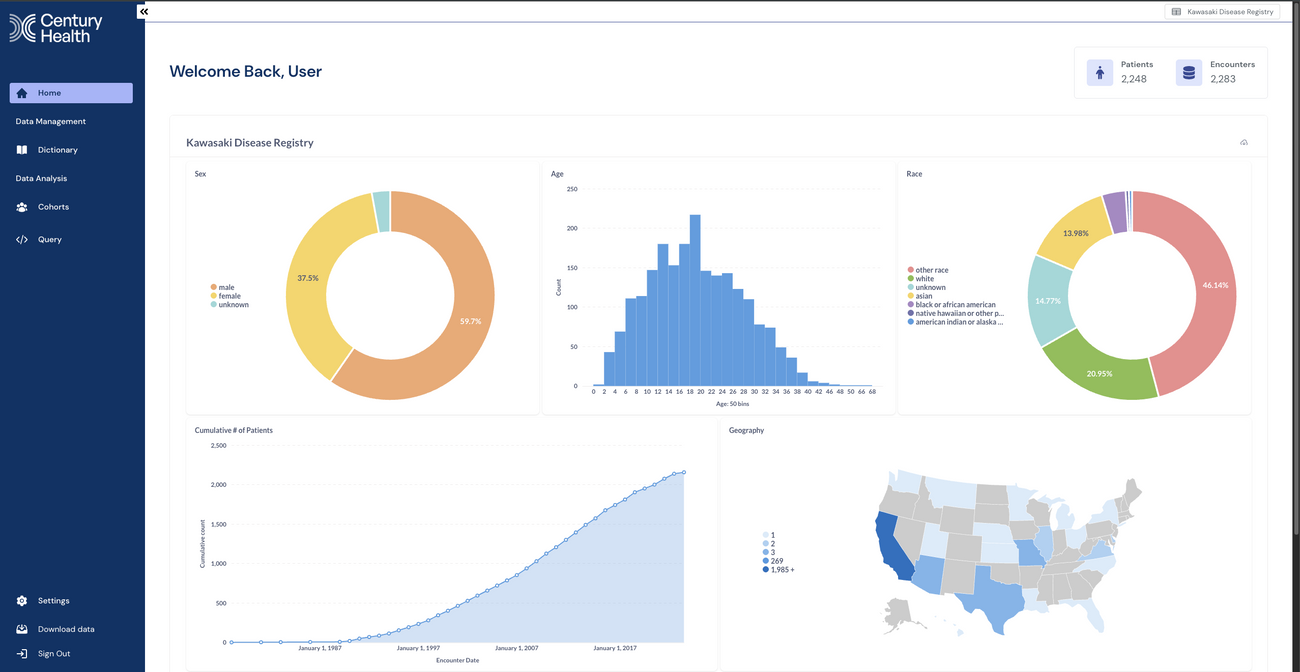
- Home shows user-friendly charts that enhance your understanding of your patient population and highlight key clinical data points.
- It shows total Patients and total Encounters at the top.
- Patient data appears as charts: Sex (donut), Age (histogram), Race (donut), Cumulative patients over time (line), Geography (map).
- You can download any chart as a PDF using the download button.
- Use the dataset registry selector on top right, to switch which dataset the charts show.
Was this article helpful?